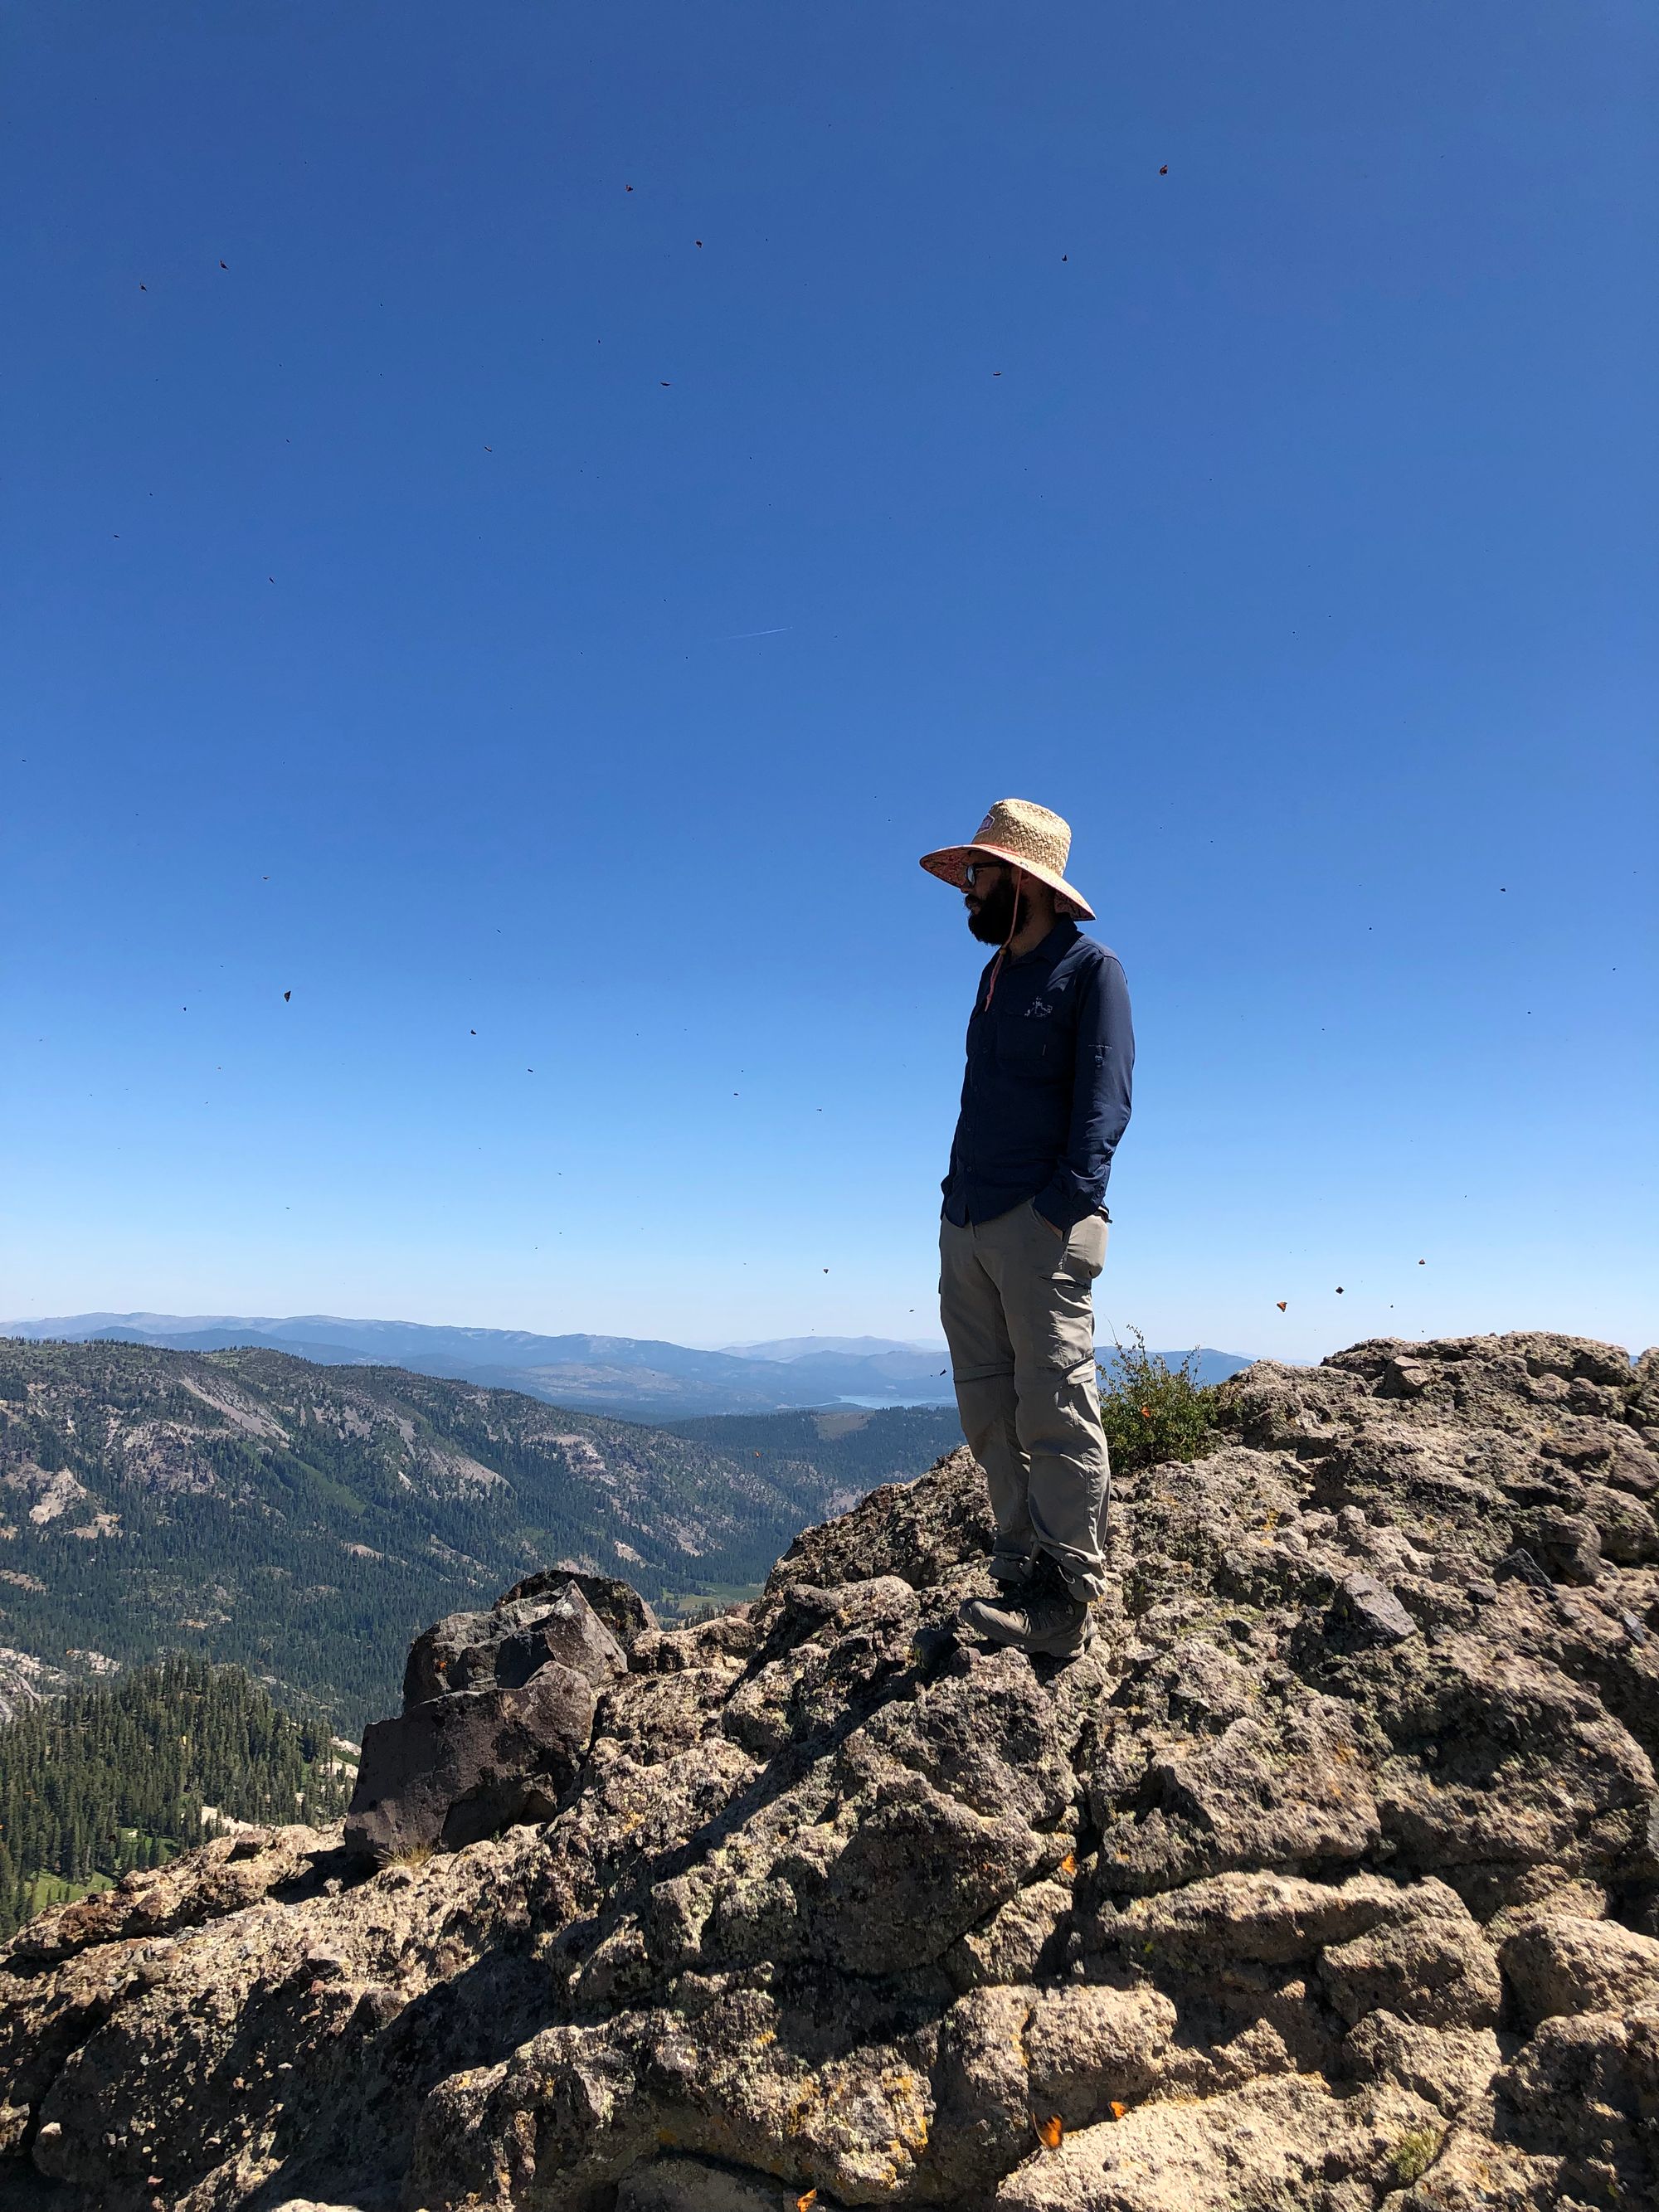
Every two weeks from March to November, Chris Halsch walks a ten-mile loop near the Donner Pass, high up in California’s Sierra Nevada, for the sole purpose of counting butterflies.
It is one of five sites at various altitudes that Halsch, a PhD candidate at the University of Nevada, Reno, has been visiting with metronomic regularity for the past five years. At each one he retraces his steps, pausing every so often to jot down species and numbers in a notebook.
Along the way, he sometimes meets recreational birders or hikers who take photographs and use nature apps to identify species for fun. But unlike those random snapshots, Halsch’s notes are a coveted resource for scientists. Once he types them into a spreadsheet, each of his data points adds a new segment to a chain of observations that has been growing without interruption for half a century, in one the world’s longest-lived efforts to monitor butterfly populations. Like a relay runner, Halsch is extending a marathon of sustained attention that began 20 years before he was born.
Multi-decadal time-series of field observations are among the rarest and most valuable artifacts in ecosystem science because they help to overcome a peculiar weakness in our ability to perceive and interpret the natural world. Humans have developed powerful methods for reconstructing events in the distant past, from the birth of a galaxy to mass extinctions in the Devonian. We have built instruments that can parse the present down to the zeptosecond. But when it comes to the modest timescale of our own lifespans, we are like near-sighted moles.
Weren’t there more birds in this meadow when we were kids?
Doesn’t it seem like spring is a lot rainier than it used to be?
Are you sure it’s safe to eat fish from this river?

Our answers to these types of questions are notoriously unreliable. Think of the tendency to describe a single weather event as evidence for (or against) climate change, or the panic caused by invasive zebra mussels that, 20 years later, turns out to have been misplaced. Perceptions are distorted by selective memories, cognitive biases, political agendas and shifting baseline syndrome—the propensity of each generation to gradually forget past environmental conditions and accept present ones as normal. In an essay published in 01990, the zoologist John J. Magnuson wrote that this temporal myopia can trap us in the “invisible present,” a space where we fail to see slow changes and are unable to interpret effects that lag years behind their causes. “In the absence of the temporal context provided by long-term research, serious misjudgments can occur not only in our attempts to understand and predict change in the world around us, but also in our attempts to manage our environment,” he warned.
Magnuson was echoing a group of mid-century scientists who believed that some of the biggest questions in ecology could only be answered with field observations that were carefully structured and repeated at the same sites for at least two decades. The longer the time-series, the greater likelihood that the invisible present will “melt away,” exposing the complex and often unexpected dynamics of ecosystem change.
They had compelling examples to point to. Rachel Carson’s Silent Spring (01962) used a 20-year time-series of migrating raptor observations made by volunteers at Hawk Mountain Sanctuary in Pennsylvania to illustrate the devastating impact of DDT and other pesticides on bird populations. In 01972, precipitation samples analyzed by scientists at the Hubbard Brook Experimental Forest, a 7,800-acre living laboratory in New Hampshire that has been continuously studied since 01955, became the first irrefutable documentation of acid rain in North America, and led to landmark amendments to the Clean Air Act.
And yet, with the exception of weather records that have been widely maintained since the late 19th century, long time-series remained extremely hard to come by. The effort required to visit outdoor locations and keep meticulous records, year after year, discouraged most scientists. Three-year grant cycles—still the standard in academia—made it nearly impossible to finance long-term experiments. The result was thousands of “snapshot” studies that look, say, at the impact of a single hurricane on the health of a mangrove forest in Key West, but almost none that describe the deeper cycles of damage and recovery following multiple hurricanes spread over 30 years.
Now, thanks to several converging developments, that short-term bias is giving way to an era in which long time-series could become a ubiquitous tool for understanding the Anthropocene.
In 01980, at the urging of leading ecologists who were frustrated by the lack of funding, the National Science Foundation launched the Long Term Ecological Research (LTER) Program with the goal of financing multi-decade observations at a network of field stations throughout the United States. The network has since grown to 28 sites where some 2000 scientists—plus many more students and volunteers—gather data on a vast spectrum of ecosystem indicators. These observations have been quietly accumulating for four decades, providing the evidence for thousands of scientific papers, theses and books. But the raw data collected in the field—first in notebooks, later in spreadsheets and databases—were often saved in fragmented and incompatible formats that essentially hid them from all but the most dogged researchers. To ensure that more people would be able to harvest this data, in 02016 the NSF financed the creation of the Environmental Data Initiative, an open access data repository that has systematized terabytes of data from LTER sites and other sources.
Scientists quickly took note. In 02017, after a study in Germany based on a 27-year time-series showed a precipitous decline in flying insects, alarm over an “ecological armageddon” flared up around the world. At Hendrix College in Conway, Arkansas, biology professor Matthew Moran wondered if similar declines had been documented in the United States. He found some studies tracking individual species, but nothing that offered an aggregate picture of multiple species in ecosystems including deserts, mountains, prairies and forests. When Moran and his colleagues examined the LTER repository, they were amazed by the richness of the data—and the fact that no one had used it to look at the big picture. “We were the first ones to put it all together,” he recalls. Moran, who has since retired, assembled a 12-person team that ultimately reviewed more than 5000 insect time-series in the LTER repository. The resulting paper, published in 02020, revealed a much more varied picture than the authors anticipated. While some species have declined, others are increasing, and overall, there was no evidence of an insect apocalypse across these sites.
In the years since the founding of the LTER program, concern about climate change has also fueled a revolution in the study of climates from before the era of direct measurements. Even as scientists were tracking the rise in atmospheric CO2 (most notably at Mauna Loa Observatory in Hawaii, now in its 64th year of observations), new technologies were enabling the creation of proxy time-series by examining tree-rings, ice cores, lake and ocean sediment samples, pollen grains and other physical evidence, some going back two million years. Other researchers began to mine archives for human observations that were not intended for scientific purposes but can yield serendipitous climate data. Magnuson and several colleagues scoured archives for references to the freeze and thaw dates of lakes and waterways, including a river in Finland where locals have been keeping such records for 325 years. Yasuyuki Aono, a professor of environmental science at Japan’s Osaka Prefectural University, has pinpointed the spring flowering date of cherry trees for numerous years over the past 12 centuries by reading diaries and chronicles written by monks, aristocrats and public officials in Kyoto starting in 0812 AD.
These studies are exposing a vast reservoir of temporal evidence that has been hidden in pre-digital documents as varied as harvest reports, livestock records and ship passengers’ memoirs—but also in scientific papers whose titles don’t openly advertise that they include time-series data. Eliza Grames, a postdoctoral researcher at UNR’s Biology Department, spends several hours each week reading the freshly scanned pages of yellowed journals and unpublished dissertations related to moths. If she finds any time-series information, she uses data-capture tools to convert analog graphs into digital formats that will be accessible to researchers. “Sometimes the graphs are literally drawn by hand,” she says. No time frame is too short. “One multi-decadal time series is great, but if you find a thousand two-year studies and they are all showing the same trend, that’s also valuable,” she says.
Grames is co-coordinator of EntoGEM, a community of scientists that is compiling all available evidence about global insect population and biodiversity status and trends. She and her colleagues are sifting through more than 60,000 journal articles to both assess the current state of published evidence and surface data sources that have been overlooked, such as the research of Norman Criddle (01875-01933), a Canadian entomologist who devoted his career to combatting the grasshoppers that would periodically devour local crops. In the process, he left behind 30 years of observations on the relative abundance of several species. “We don’t have a lot of grasshopper population data from before 01920,” Grames says. “These records aren’t perfect, but they can complement other sources and help us better understand an issue.”
EntoGEM is one of several initiatives that aim to synthesize temporal evidence by conducting better meta-analyses of disparate data sources. BioTIME, a consortium based at the University of St. Andrews in Scotland, is curating a collection of time-series that track the assemblages of species that live in particular ecological communities. So far it has gathered records on more than 600,000 distinct geographic locations, some going back 130 years. More broadly, large international repositories such as DataONE and the Global Biodiversity Information Facility (GBIF) are facilitating access to time-series as part of the movement toward open science and FAIR data.
Collectively, these efforts are widening the aperture of our ecological attention, enabling scientists to find and stitch together scattered fragments of temporal data into panoramas that tell a more illuminating story about the interactions that drive change. Unfortunately, the emerging picture is still largely focused on wealthy countries—particularly ones with long histories of field-based science. A map of the International LTER network, an association of 750 field stations that, like their U.S. counterparts, are making long-term observations, shows that more than two thirds are concentrated in Western Europe. Numerous countries in Asia, Africa and Latin America have no stations at all. Moreover, even as scientists like Moran and Grames are exploiting the new wealth of temporal evidence, it is not clear how this research will influence the wider culture, where the blinkered perceptions of the “invisible present” are still pervasive.
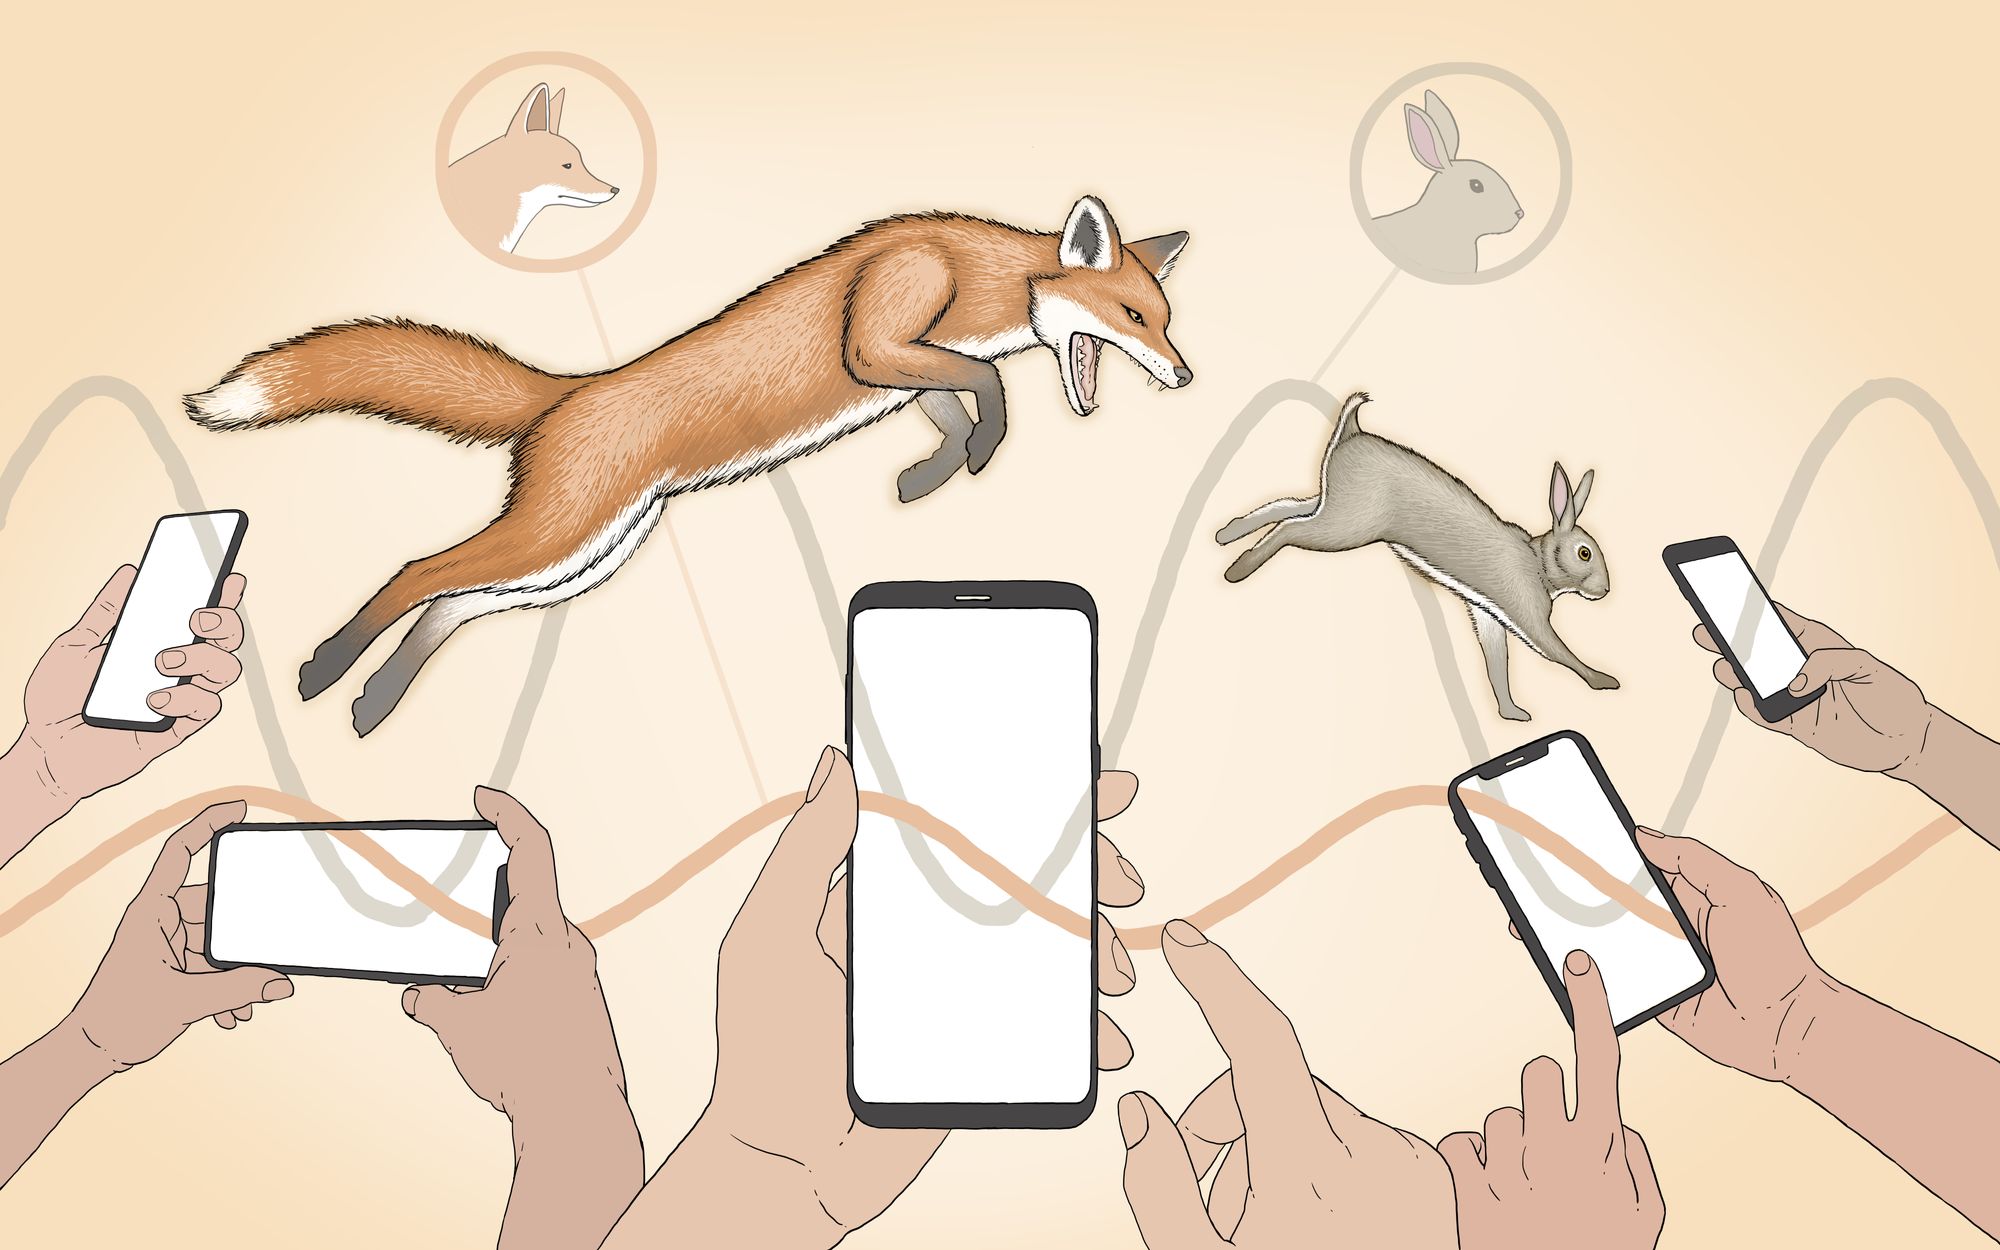
The trend that may ultimately overcome both of these limitations is driven, paradoxically, by smartphones. Non-scientists have long been a critical source of field labor for long time-series, most famously for the Audubon Society’s 122-year-old Christmas Bird Count, but also in hundreds of smaller projects that monitor other kinds of flora and fauna. Now, smartphones with powerful cameras and apps such as eBird, iNaturalist, Seek and Picture Insect have enabled millions of casual observers to supplement this pool of dedicated volunteers. Despite the lively debate on whether smartphone usage in the outdoors enhances or interferes with people’s appreciation of nature, one fact is clear: because nature apps automatically time-stamp, geo-reference and store each observation in a robust database, they are generating potential time-series at an unprecedented scale.
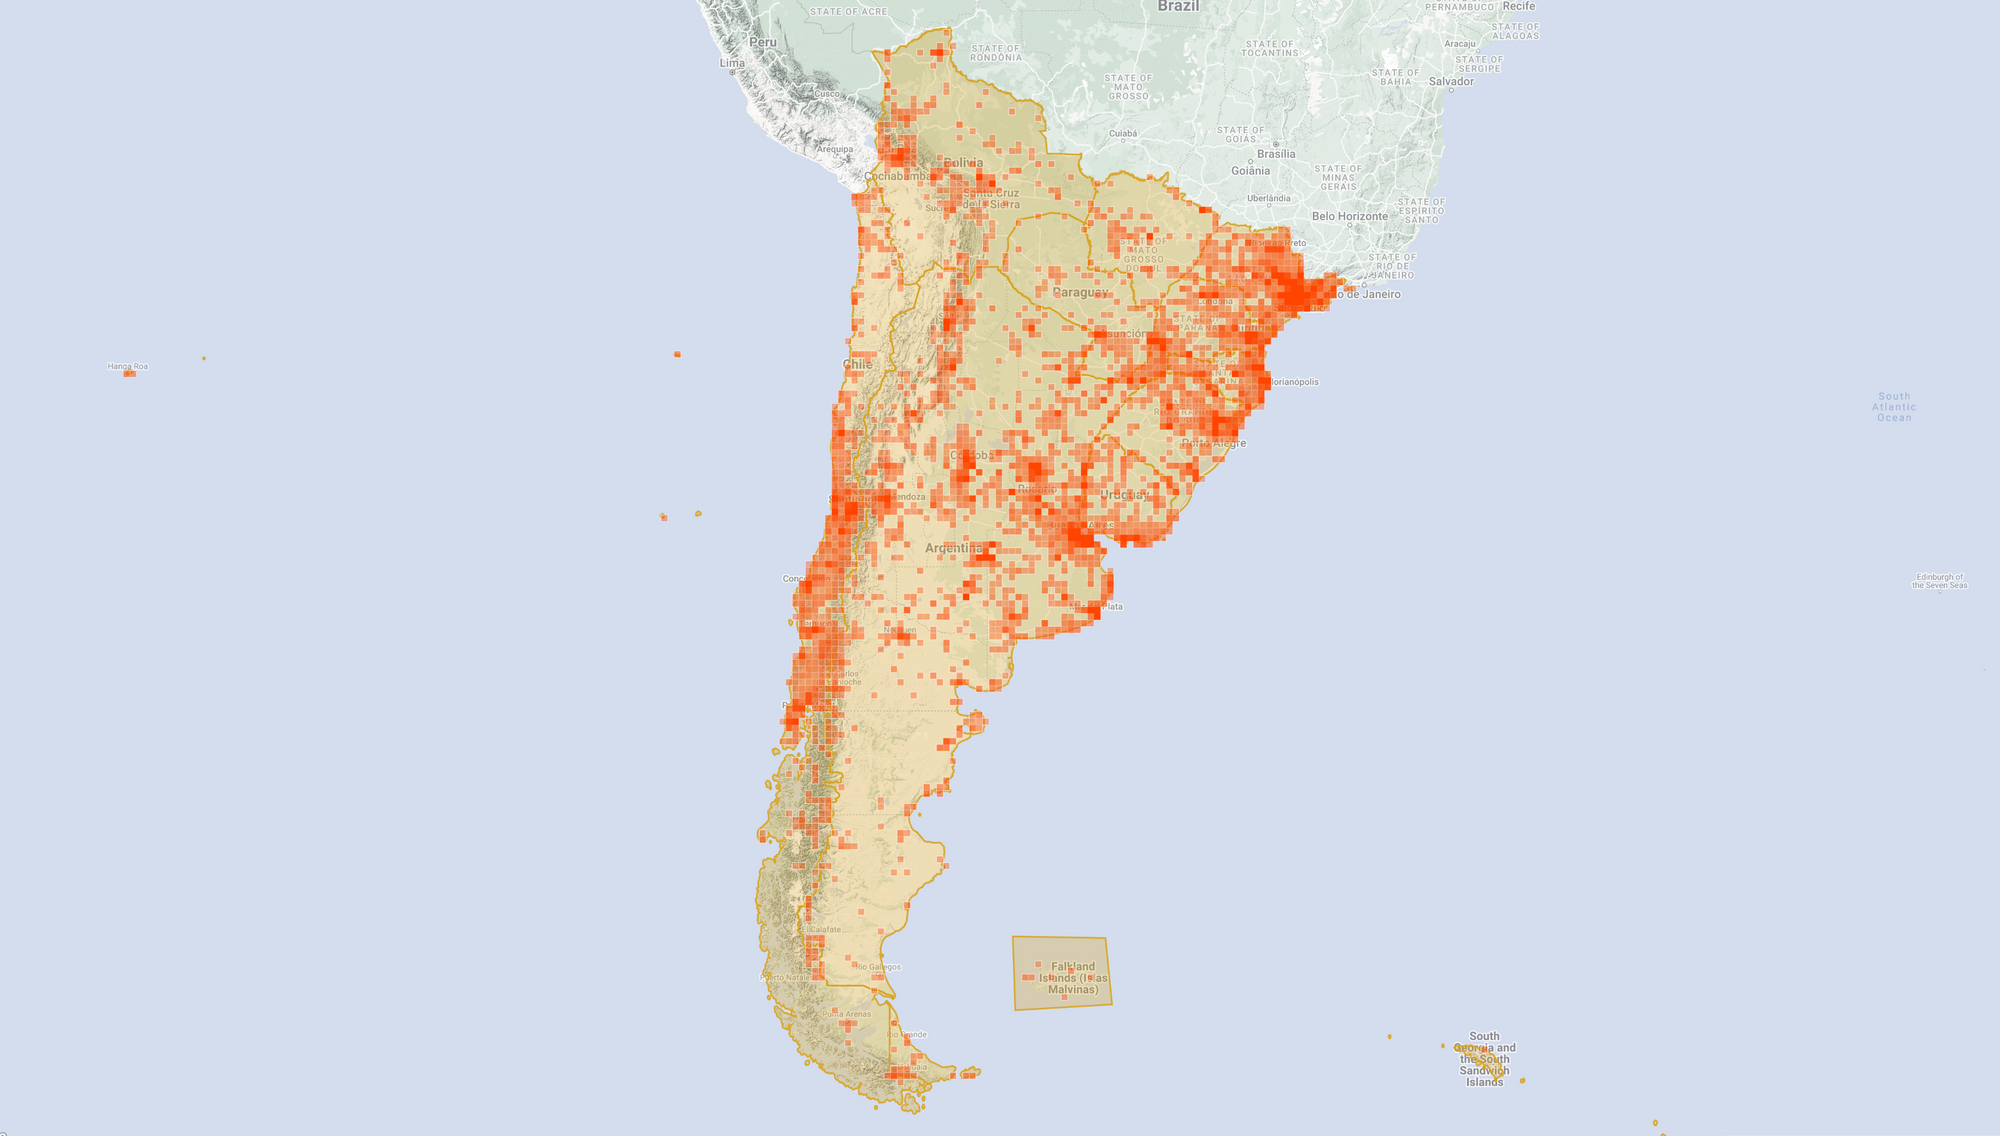
In the 20 years since the Cornell Lab of Ornithology launched eBird, the app has amassed more than one billion observations by 700,000 birders from every country in the world. Carrie Seltzer, who heads stakeholder engagement at iNaturalist, says that more than 2.4 million people have made observations on the app, at a rate that has grown between 50 percent and 100 percent per year since 02012. “By October of 02022, iNaturalist had accumulated nearly 120 million observations, more than half of which have been classified as ‘research grade’ because the species has been verified by more than one user,” she says. Although observations in industrialized countries still predominate, iNaturalist users in the global South are rapidly catching up. In virtually every country on the planet, users have created dozens of self-administered “projects” that gather observations around specific themes. A group of spider enthusiasts in the Southern Cone of South America, for example, has so far uploaded 87,000 observations of 853 species.
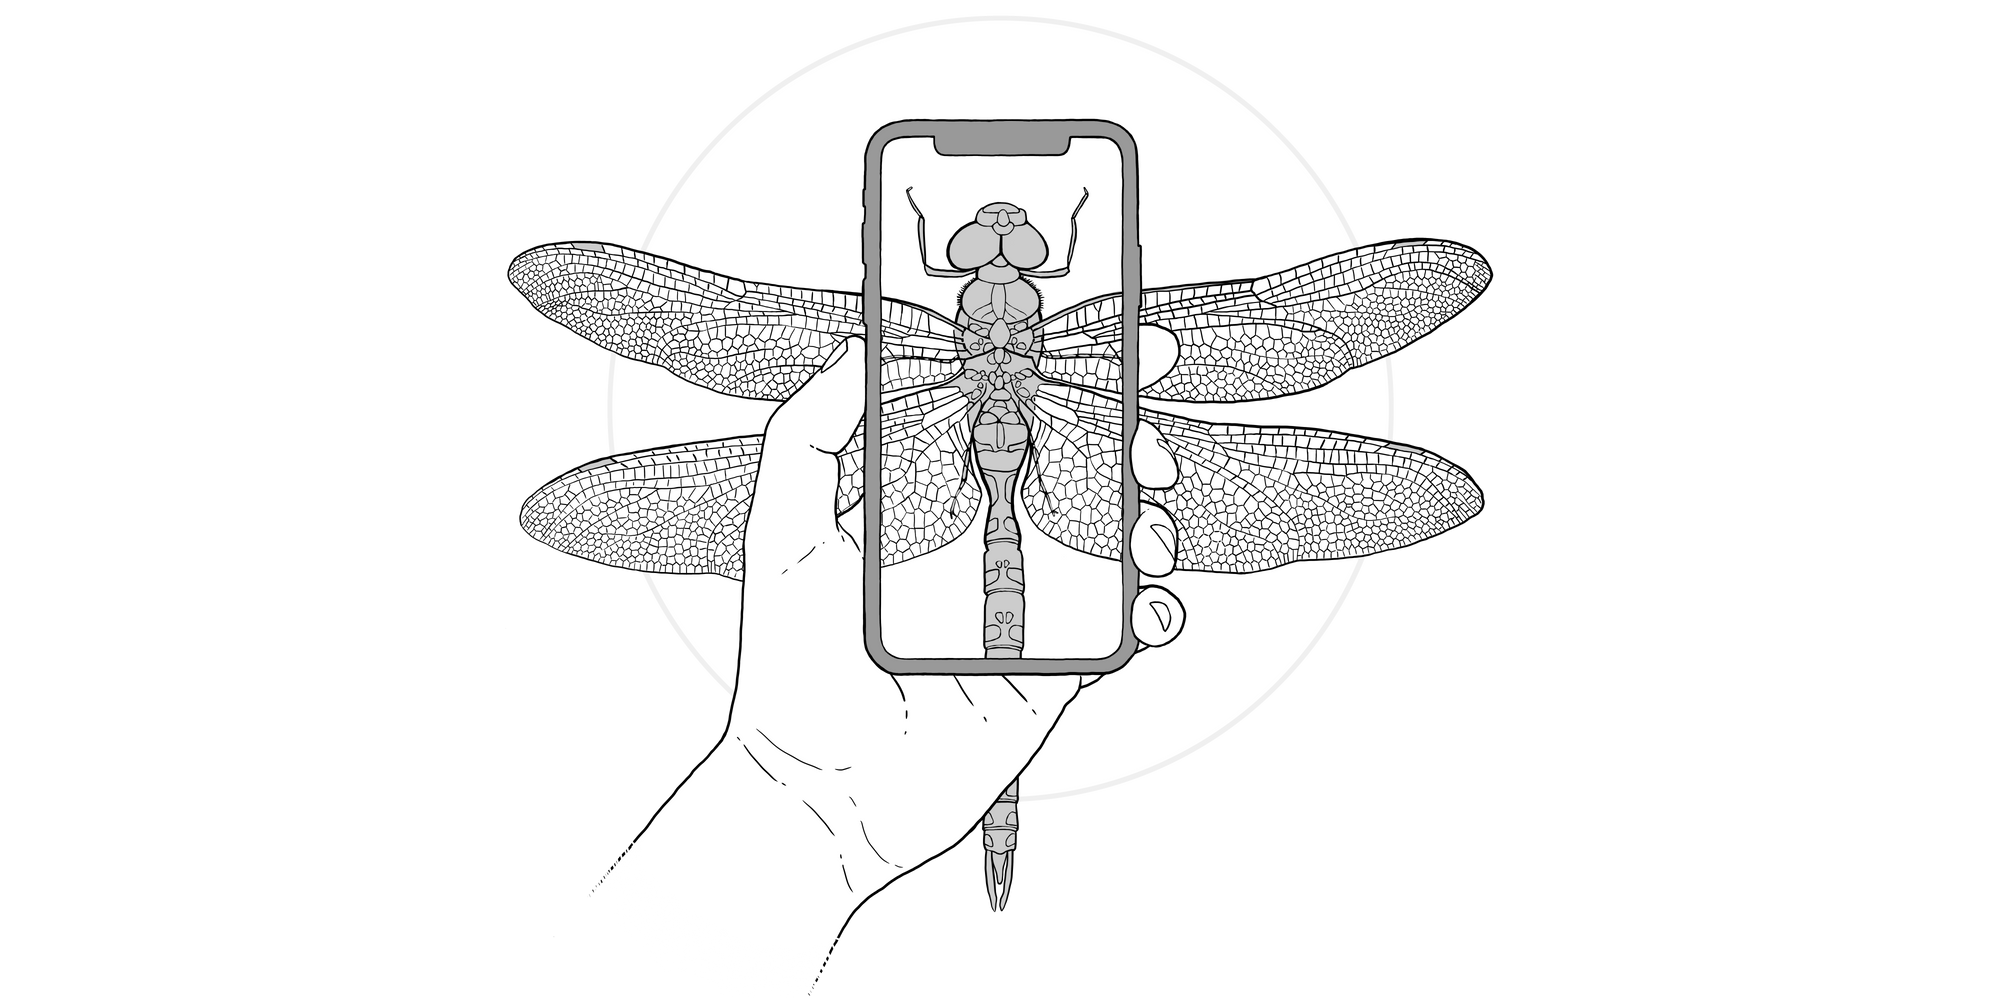
This torrent of raw field data vastly exceeds what even well-funded researchers could ever dream of gathering with traditional methods. Not surprisingly, scientists have already published more than 2,800 studies citing iNaturalist data. One of them is Michael Moore, an assistant professor at the University of Colorado Denver. In 02019, he was pondering the potential impacts of rising temperatures on the evolution of wing coloration in dragonflies when his partner introduced him to iNaturalist. “I logged on and saw that at that time, there were around 14,000 observations of just one of the species of dragonfly that I wanted to study. I realized very quickly that I could essentially answer this question using the data that was already there.”
In 02021, Moore and his colleagues published a paper showing that over just 17 years, males of several species of dragonflies have evolved less breeding coloration on their wings in regions with hotter climates—a change that affects their breeding success and internal temperature regulation. The principal evidence was citizen science observations from GBIF and iNaturalist. “Thanks to this data, we’re able to literally watch evolution take place at a grand scale,” says Moore, who last year gave a keynote presentation entitled “How citizen science is super-charging the study of evolutionary adaptation” at the American Philosophical Society.
Moore acknowledges that citizen science data presents numerous statistical challenges. Sudden growth in users and observations can create the illusion of population growth in a species that simply was not being observed in the past. Observations are concentrated in accessible spots near cities and roadways, and they almost never occur at regular intervals over multiple years in the manner of Chris Halsch’s biweekly butterfly surveys. But Moore shares the optimism of many other researchers who believe that the sheer volume of these observations, combined with advances in data science and artificial intelligence, are enabling researchers to correct for these factors and extract powerful insights from citizen science. He also believes that by getting millions of people to discover the joy of habitual observation, these apps will ultimately deepen public understanding of incremental ecosystem change—and support for conservation.
Halsch, who has walked several thousand miles while gathering butterfly data for his PhD, straddles the age of laboriously hand-crafted time-series and the future envisioned by Moore. Although the fieldwork can be monotonous at times, Halsch says on most days he relishes the prospect of being outside with his notebook, his mind temporarily free of all other responsibilities. He has also come to love the analytical side of the research much more than he expected. “There’s a real sense of importance of the work, and the tremendous power of a long time-series,” he says. “There are things we can do because of the length of these data that no one else can do. It’s a quantitative gold mine.”
Matt Forister, a biology professor at UNR who is Halsch’s dissertation advisor, worries that some young scientists are not achieving this balance between observation and analysis. “There’s so much veneration of large data sets these days, and of the computational challenges of interpreting them, that I feel like too many students are just training to wrestle with big data,” he says. “They feel like all the data is already out there—we don’t need to go collect it.” Forister believes that paying close and repeated attention to “the chaos” of natural systems in the field is essential to sparking our awareness of anomalies and generating new questions. Although he is a tenured professor with his own lab and he could easily delegate, Forister chooses to spend hundreds of hours doing field work each year.
It is a mindset he picked up two decades ago from his own thesis advisor, Art Shapiro, a professor of evolution and ecology at the University of California, Davis. Shapiro began monitoring butterflies at 10 sites in a transect across central California in 01972. He single-handedly conducted observations at all the sites for more than four decades, amassing data that has become indispensable to understanding the decline of butterflies in the state, among other issues.
Around five years ago, when knee pain was making it harder for Shapiro to maintain his grueling fieldwork schedule, Forister offered to personally take over monitoring five of the sites. He subsequently recruited Halsch, with whom he tag-teams to ensure that no site ever misses its scheduled survey. Shapiro, at age 76, is still visiting five of the lower-elevation sites every two weeks. Forister, 48, intends to keep doing so “for at least another 20 years,” and he is confident that younger scientists will be happy to take the baton and maintain the time-series “in perpetuity.”
Halsch, 29, expects to help train a successor. “I often think about the fact that ideally, no one will see this to completion,” he says. “I’m going to do this for as long as I’m here, and then someone else will continue it.”