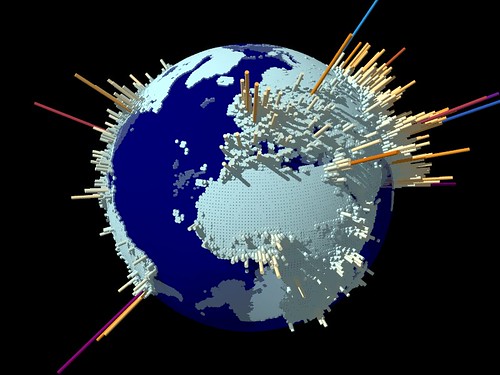
I recently came across these amazing data driven globe’s from Yale’s G-Econ group. The one above represents population density, but their tool allows for all kinds of data to drive the topology from average rainfall to distance from coastlines.
I recently came across these amazing data driven globe’s from Yale’s G-Econ group. The one above represents population density, but their tool allows for all kinds of data to drive the topology from average rainfall to distance from coastlines.
Join our newsletter for the latest in long-term thinking
Subscribe